Computer visualization of terrain is an
important part of my research. This page contains numerous examples
of the types of visualizations we have experience with, but most
are now several years old.
My latest visualization project is called
EarthSLOT: an Earth Science Logistics and Outreach Terrainbase.
It allows users to interactively fly themselves anywhere on earth
and see the terrain in 3D. Various data layers are also superimposed,
such as locations of study areas, equipment, etc. You can check
it out here: www.earthslot.org.
Some of the animations on this page require Quicktime/QuicktimeVR,
which you can download from the internet for free. The installation
files are only a few megabytes and we have never experienced any
conflict issues with their installation.
Please do not use them in any presentations or web pages, or modify
them, without my prior consent. I just like to know how they are
used.
|
Intermap Technologies Digital Elevation
Models (DEM) |
| Intermap Technology Corporation has
a LearJet 36A with an onboard X-band SAR interferometer that can create
high resolution Digital Elevation Models quickly, easily, and in almost
any weather. The spatial resolution of their DEMs is 5
m with better than 1 m vertical accuracy. We have extensive
experience using Intermap DEM products in both Alaska and worldwide. Below
are several examples of our visualizations from prior projects involving
Intermap DEMs. For more information on these DEMs, visit
www.intermaptechnologies.com. |
Lower
Kuparuk, Alaska - Still Images
Isabel
Pass , Alaska - Still Images
|
IKONOS Imagery |
| Space Imaging Corporation operates
the Ikonos satellite, which provides multispectral data at 4 m resolution
and panchromatic data at 1 m resolution. These can be fused
together to produce high resolution color images anywhere on earth. We
have worked with several of these Ikonos images. Below
are some examples of our use of this imagery from prior projects. For
more information, visit www.spaceimaging.com. |
Lake
El'gygytgyn, Russia - Ikonos Mosaic
Lake
El'gygytgyn, Russia - Animated Fly-By following Lake Shore
|
´Color Radar´ Textures |
Simultaneous with the acquisition
of elevation data, the Intermap Star3i system also acquires a radar
amplitude image which is valuable in and of itself. One
limitation of such intensity of backscatter images is that they must
typically be presented as a grayscale. We are proficient
in merging such grayscale images with color imagery. Below
are some examples of Landsat imagery (30 m) sharpened with Star3i
amplitude images (2.5 m), to create a low-cost, high-resolution alternative
to Ikonos imagery, used as a texture draped over the Star3i DEM.
|
Upper
Kuparuk, Alaska - Still Images
|
Synthetic Terrain Textures |
| One problem with traditional 'imagery
over elevation' type visualizations is that the objects in the image,
such as houses or trees, appear flat. Draping synthetic
terrain textures over elevation data provides an alternative that
can be more realistic in appearance than high resolution imagery. We
plan to incorporate this technology in several of the passes where
it will make significant improvements over orthoimagery. Below
are a few examples of our ability to create various types of synthetic
terrain textures in various landscapes. |
Lower
Kuparuk, Alaska - Animated Fly-Through
Lake
El'gygytgyn, Russia - Animated Fly-Through
Pinon
Canyon Maneuver Site, Colorado - Still Images
Isabel
Pass, Alaska - Still Images
Lower
Kuparuk, Alaska - Synthetic Texture Still Frame
|
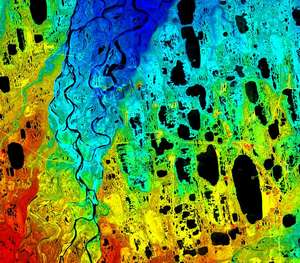
3D Data Visualizations |
In addition to 'raw' remote sensing
data, the visualization of derived products is also an important part
of our research. Our remote sensing projects thus far have
been mostly related to soil moisture, but any land-cover classification
or remotely-sense derivative project can be overlaid onto a DEM. Here
are a few examples of soil moisture overlay, derived from a SAR technique
we developed, in an arid region of Colorado; red indicates drying
and blue indicates moistening between two SAR acquisitions.
|
Download
Soil Moisture Overlays (3.5MB) - unzip and launch locally
|
´True 3D´ Visualizations |
Anaglyphs have been used in everything
from still images to horror movies, but can also serve as a useful
means to evaluate scientific data. Viewing such visualizations
requires the familiar red and blue glasses (not included on this disc). Below
is an example anaglyph of Hubbard Glacier trying to close off Russell
Fiord.
|
Hubbard
Glacier Anaglyph JPG, small
Hubbard
Glacier Anaglyph TIF, large
|
Quicktime VR Panoramas |
We have extensive experience using
technology that allows us to mosaic digital photos and link them into
interactive panorama photo applications. These applications
give users the opportunity to visualize the view from a particular
point in 360 degrees. Below are a few examples from prior
projects.
To move the view within the panorama either hold down the left mouse
button while moving the mouse over the panorama, or use the controls
on the lower left corner of the panorama screen. |
Lake
El'gygytgyn, Russia - Panorama 01
Lake
El'gygytgyn, Russia - Panorama 02
Pinon
Canyon Maneuver Site, Colorado
|
3D Draping of Oblique Photos |
| Often
DEMs and vertical imagery are unavailable for a project area, particular
on the smaller scale. In cases like this, we are able to take oblique
photography and create a 3D representation of the area, then treat
it like a 3D object we can fly around. Here is an example of such
a photo-draping effect showing the UAF campus, created using a single
oblique photo with no prior topography information. Had we additional
photos, we could have created a full 360 degree view. |
UAF
Campus - oblique photo derived fly-by
|
Research Site Visualizations for Web Pages |
Much of our research occurs in remote
locations, often in places that most scientists cannot access. Lake
El´gygytgyn, Siberia, is one such location. Below
is an HTML application that combines many of the visualizations shown
above into a web-hostable package that requires no special software.
|
| Research
at Lake El´gygytgyn, Siberia |