Kuparuk River watershed DEM
| Kuparuk River watershed DEM |
|
Validation Samples
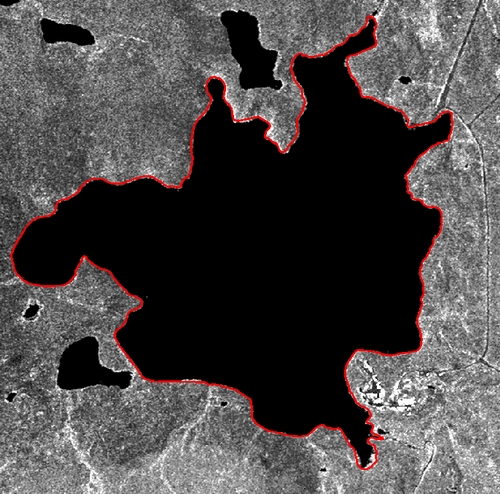
Upper Kuparuk, Toolik Lake - Red outline was created from D-GPS points which were continiously acquired to establish the lake boundary. Slight differences may be attributed to the fact that the D-GPS data was acquired in the Spring and the ORRI was acquired in late August, thus showing a different water level. Image approximately 2 km across.
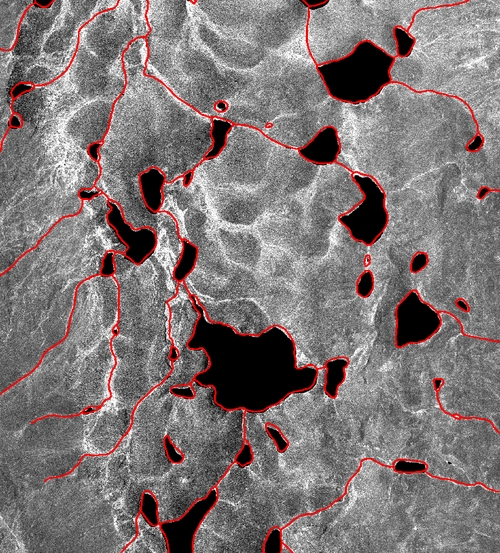
Upper Kuparuk - USGS 1:63,360 Hydro DLG created from airphotos in 1949 is show in red; lake boundaries and streams match the ORRI closely. Image approximately 5 km across.
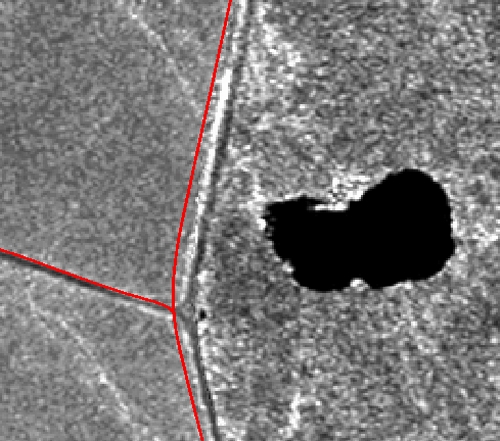
Upper Kuparuk - D-GPS Roaddata; data shift of up to 25 m is visible. Image approximately 500 m across.
return to Data Validation page
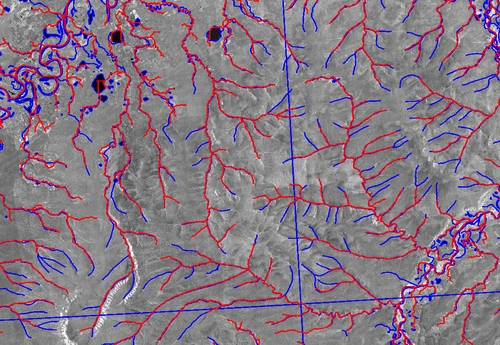
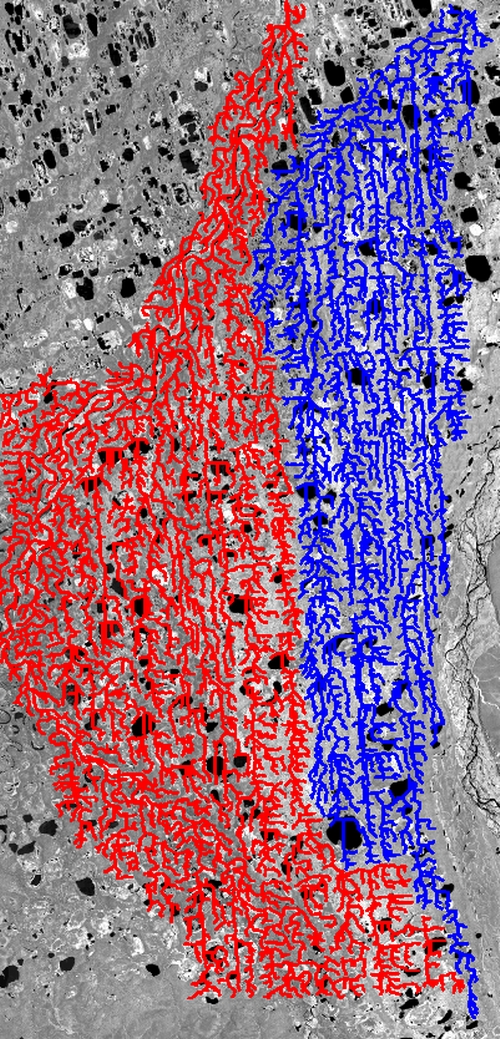
Kuparuk Basin - USGS DLG data is shown in blue, Star3i derived stream channel network is shown in red. Both of these channel networks are available as shapefiles included in this distribution. Image approximately 22 km across.
return to Data Validation page
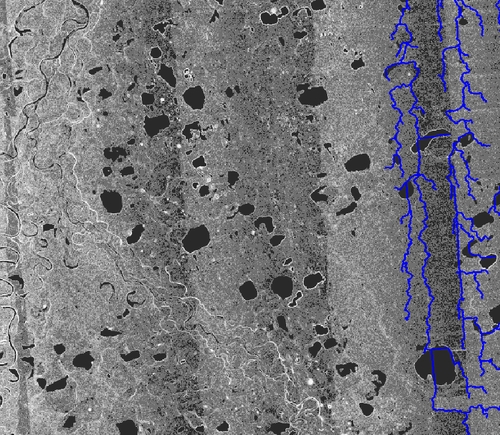
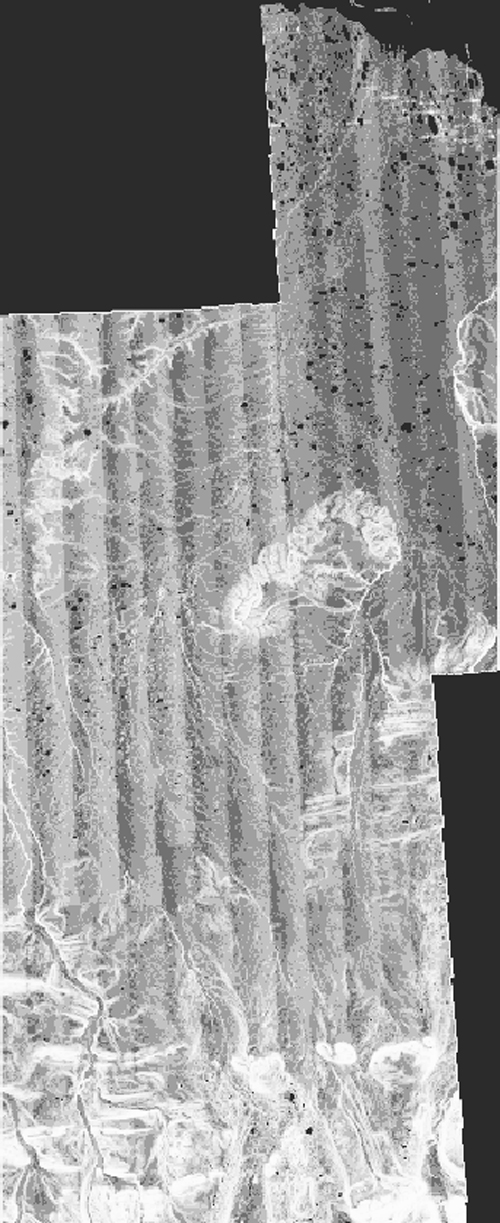
Kuparuk, Putuligayuk Basins - In this slope image of the Star3i DEM acquisition swaths are clearly visible. Putuligayuk stream channels (shown in blue) are partially aligned to the acquisition swaths. Also see the slope image of the entire DEM below. Above image approximately 29 km across, image below 92 km across.
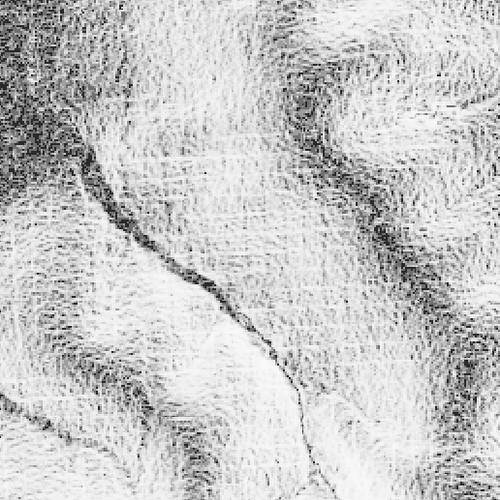
Kuparuk Basin, White Hills - Regular grid pattern noise phenomenom, Star3i processing artifact. The image shown is a slope image derived from the Star3i DEM at 5 m posting. The posting of the noise grid is approximately 100 m. Image approximately 3 km across. return to Data Validation page
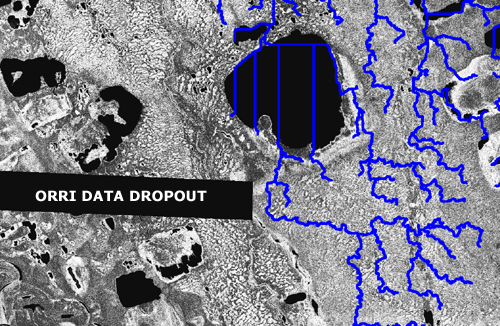
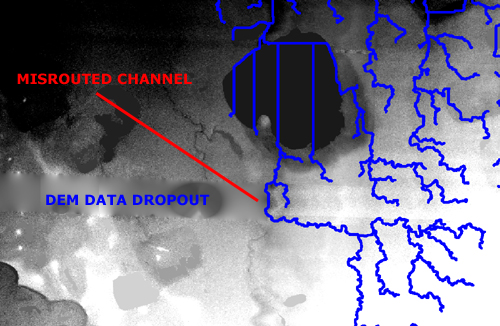
Kuparuk, Putuligayuk Basins - Data dropout area is clearly visible as black polygon in this ORRI image. The Putuligayuk stream channels as derived from the Star3i DEM are shown in blue. See the next image for a more clear view of the misrouted stream channel. Image approximately 8 km across.
Kuparuk, Putuligayuk Basins - This is a DEM image of the same area that is show in the ORRI above. Interpolation attempts are clearly visible in the area of data dropout. The channel that is labeled in red should be draining into the Kuparuk, which is supported by the ORRI as well as the USGS Hydro DLG (not shown). Because of the data dropout the channel is misrouted into the Put and adds approximately 120 km2 to the Put basin area. Image approximately 8 km across. return to Data Validation page
Kuparuk Basin, NW Corner - The mission missed the Kuparuk basin by approximately 2 km2 in the NW corner of the data set. The USGS Hydro DLG is shown in blue, the area of estimated missed data is shown in red. Image approximately 15 km across.
Kuparuk Basin, SE Corner - The mission missed the Kuparuk basin by approximately 40 km2 in the SE corner. The USGS Hydro DLG is shown in blue, the area of estimated missed data is shown in red. The area of missed data has been estimated using a USGS NED DEM for the area we did not have a Star3i DEM for. Stream channels generated from this Star3i-NED merged data set resuled in coverage of the area shown in red. Image approximately 28 km across.
return to Data Validation page
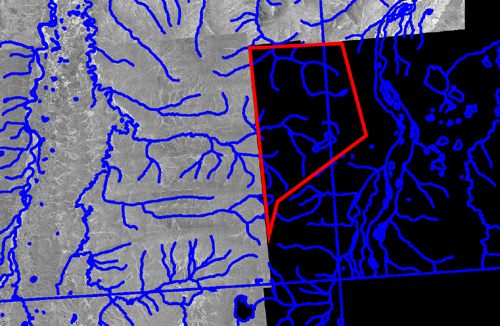
Kuparuk, Putuligayuk Basins - The above image shows computer generated stream channel networks for the Kuparuk in red, and the Putuligayuk in blue. These channels have been derived from a 10 m posting DEM. Due to memory contrains it was not possible to process the entire Kuparuk at 10 m and thus we used a subset to show an area of interest where the two watersheds share a common border. Please compare this model output to the one below. Image approximately 40 km across.
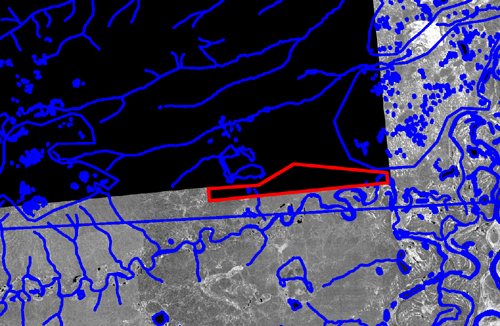
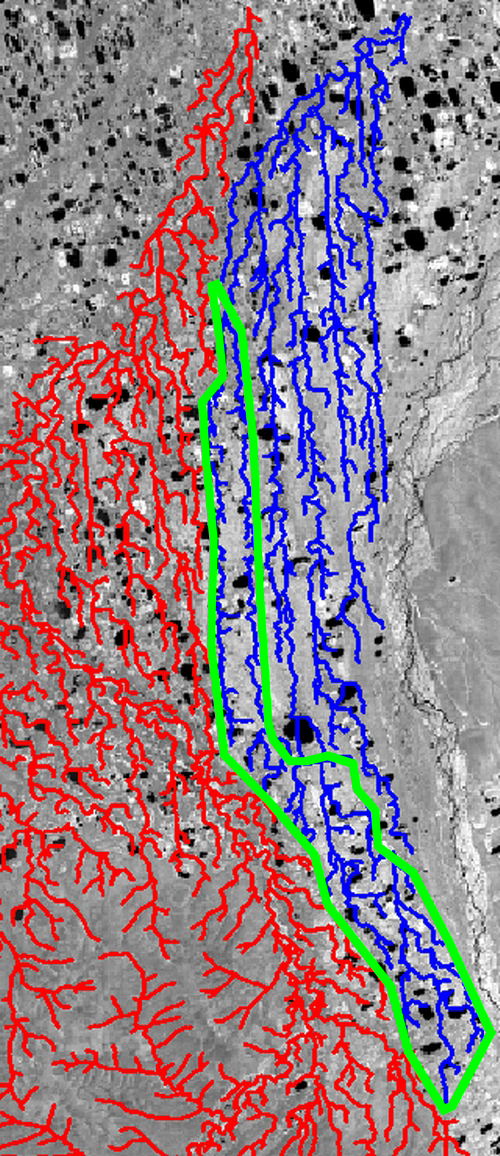
Kuparuk, Putuligayuk Basins - The above image shows computer generated stream channel networks for the Kuparuk in red, and the Putuligayuk in blue. These channels have been derived from a 25 m posting DEM. Noteworthy is that because the data has been resampled to 25 m positings the watershed boundaries have shifted and an area (green outline) that was previously draining into the Kuparuk (as determined by 10 m model output, as well as by visual evaluation of the USGS Hydro DLG and the Star3i ORRI) is now erroneously draining into the Put. Image approximately 30 km across. |