DInSAR Measurement of Soil MoistureMatt Nolan (UAF) and Dennis R. Fatlan (Vexcel) |
|
| New Techniques for Measuring Soil Moisture
are Needed The water content of the thin layer of soil covering our earth’s land surface plays a major role in the dynamics of our terrestrial environment and therefore merits the considerable attention it receives from the scientific community, the military, farmers, engineers, and forest-fire fighters. Unfortunately soil moisture is difficult to measure over large spatial areas, and a remote sensing technique that combines high spatial resolution with good accuracy has long been an elusive goal. We believe that differential radar interferometry (DInSAR) may be a viable tool for measuring such changes in soil moisture. |
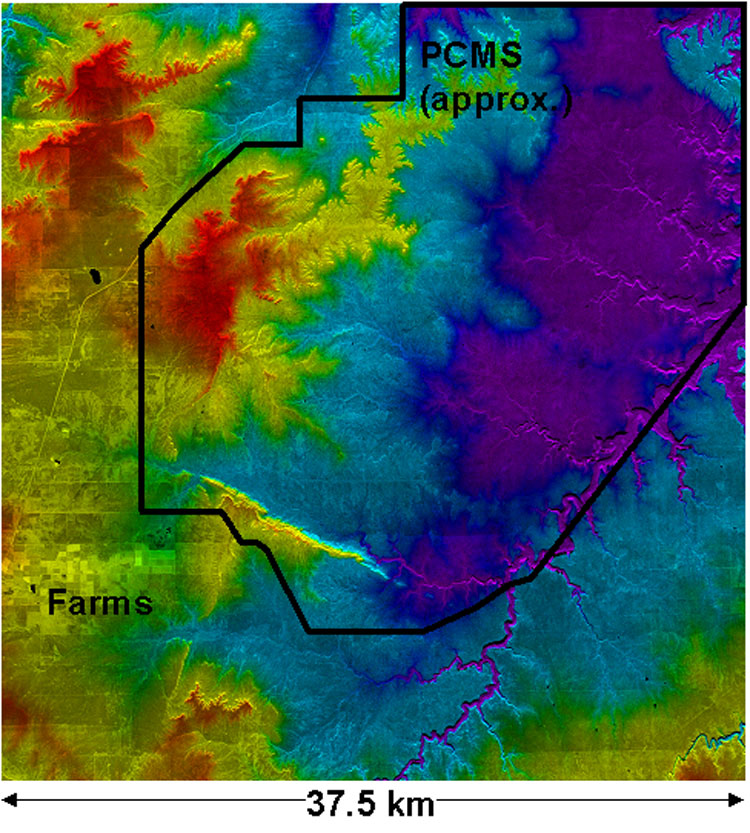
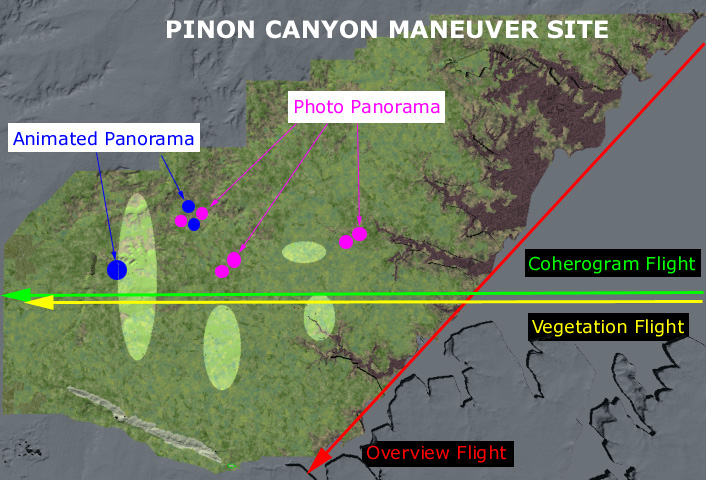
| The Pinon Canyon Maneuver Site: A Great
Study Area The Pinon Canyon Maneuver Site (PCMS) in southern Colorado is home to large-scale tank maneuvers by the US Army, who have a strong interest in real-time, remote measurement of soil moisture over large areas for off-road vehicle trafficability. PCMS is a generally low-gradient area, punctuated by moderate to extreme relief. It is sparsely vegetated over most of its area, with an above-ground biomass of less than 0.5 kg/m2 that has negligible effect on imaging microwaves. It is an arid environment, with high temperatures and solar radiation drying the soils rapidly following brief but intense convective storms. PCMS is therefore a nearly ideal study site for developing new DInSAR techniques. |
 |
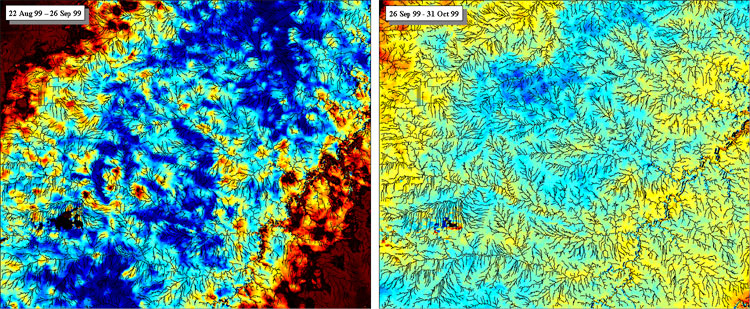
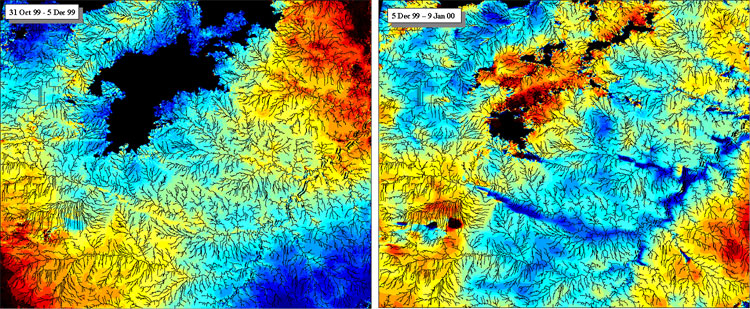
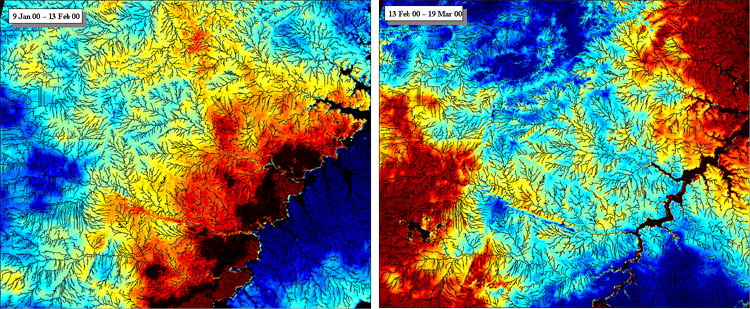
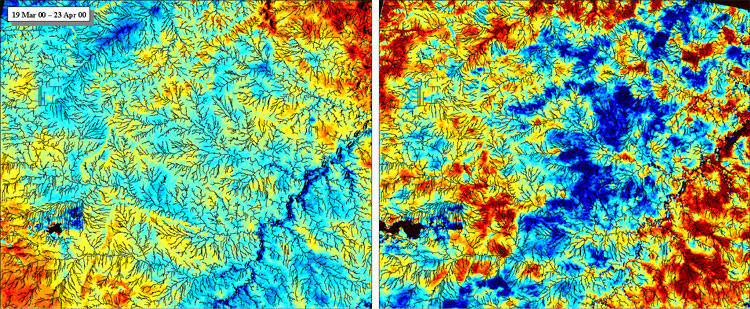
| Results: Differential Interferograms with
Both Spatial and Temporal Variation Using ERS data we created eight 35-day-repeat differential interferograms (“DIGs”, shown below) using a high quality Star3i DEM from Intermap Technologies Corp. to remove topographic phase. The colorbar indicates millimeters of slant range variation within each DIG, which were reduced to a zero mean to account for large-scale atmospheric phase distortion. For example, a particular shade of red indicates a 5 mm increase relative to the mean displacement of an individual map. The black lines on the images are stream channel networks created using the DEM, which can be used as a proxy for visualizing topography. Note that the images show good phase coherence and have spatial features vary with time but are often related to watershed boundaries. Decorrelation through a large canyon caused phase unwrapping errors in the Jan-Feb pair (lower left). |
    |
| This Temporal and Spatial Variability is
Not Due to Processing Artifacts, Transient Atmospheric Phenomena, Seismic
Events or Surface Subsidence The small-scale variations observed here cannot be fully attributed to either topographic residuals or atmosphere/ionosphere anomalies, as these effects typically occur on a much larger scale. Geologic explanations such as fault motion, volcanism, or surface subsidence from aquifer depletion are easily ruled out. Further, the strong correspondence between phase change and watershed boundaries and the fact that these relationships change temporally, suggest a change in the surface dielectric, most likely related to soil moisture. Surface swelling due to changes in soil moisture cannot be fully ruled out, but this would likely occur only in clay rich soils, and we observe change in all soil types. |
| Theory Supports a Soil Moisture Explanation ERS DInSAR measures changes in the two-way path length of the SAR microwaves. These changes in path length are typically assumed to be caused by surface displacement, but a change in the penetration depth, Dp, into the earth will also change the path length. Theory indicates that Dp is strongly affected by soil moisture. Note that while Dp is a non-linear function of soil moisture, it is fairly linear in its typical range (10 to 40%). We can determine the accuracy of our technique by equating topographic phase with deformation phase. We used a Star3i DEM with vertical accuracy of 2 m, so our DInSAR results should have an error about 1 mm (with a 100 m baseline). We have created a one week time-series of reasonable soil moisture profiles that simulate a rain event on day two, and calculated Dp for L, C, and X band microwaves. The range in modeled Dp (15 mm) is the same as the majority of those in our DInSAR measurements of path change, as shown in the results and colorbar diagram on the previous page. Thus there is strong theoretical support for a soil moisture source the variation in our DIGs. |
    |
| Preliminary Modeling Indicates Coherent
Phase Change is Possible We developed a model to determine whether or not our theoretical changes in penetration would cause InSAR decorrelation. We model scatterers at depth with random phase that contribute to returned phase based on attenuation strength at that layer, where attenuation is based on theory (above). Elements within a 20x20 matrix of ‘Pixels’ each aggregate 31x31 scattering columns, as well as a gaussian contribution from neighboring pixels. Differencing model runs produces pseudo-DIGs that qualitatively suggest coherence is possible under a broad range of soil moisture conditions. Below to the right, increasing moisture in the center of the matrix increases noise but with a non-zero mean, as in our DInSAR results. |
  |
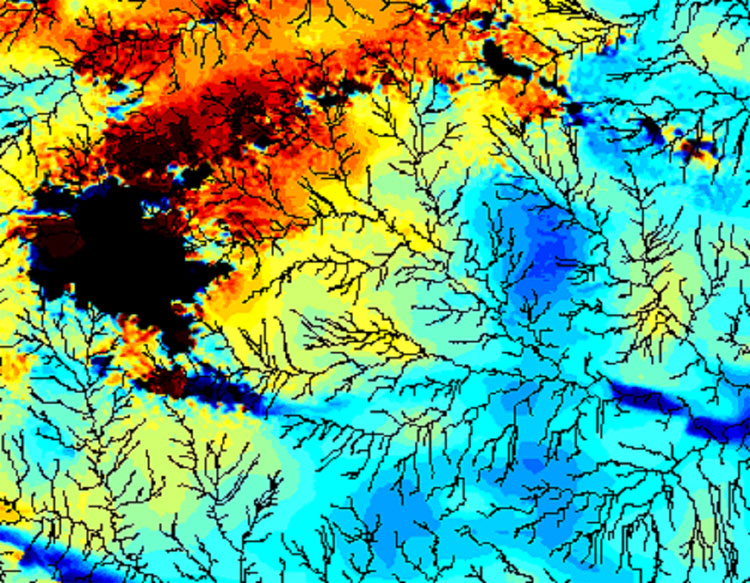
| Topography, Vegetation, and Precipitation-Dynamics
Qualitatively Support a Soil Moisture Explanation We found correlations between our DInSAR results and topographic, vegetative and soil type boundaries (topography example at right). Because water drains downhill and is retained preferentially by different vegetation and soil types, this is expected. Our experience has shown that high discharge rain events can occur without being recorded by any of the 16 weather stations in PCMS. Therefore it is difficult to develop intuition about what our results should look like, because we cannot be sure where or when rain events have occurred. Snow fall, and subsequent snow melt, occurs regionally and our results qualitatively match our intuition in this case. For example, the Dec-Jan pair (observing snow melt) is limited to a single sub-watershed, and shows drying in the hills and dampening in the valleys, just as we would expect (below). |
 |
| Field Measurement of Soil Moisture is Inconclusive
We established four meteorologic stations in PCMS to record both weather and soil states, supplementing the 12 weather stations at PCMS run by the USGS. The shallowest we could place our probes was ~5 cm below surface. Unfortunately the dusty soil layer above this likely has a very different response to rain than the soil below – it quickly supersaturates then dries rapidly – and the SAR signal rarely extends through this layer. Thus the trends that we measure with our probes may not be the same trends as observed with SAR, yielding poor correlations. New probe designs will likely improve these correlations. |
 |
| Conclusions: Differential InSAR Shows Considerable
Promise for Measuring Soil Moisture Remotely at High Resolution Over Large
Areas, And Future Research Could Lead to New Interferometric Satellite
Missions for this Purpose |
Visualizations |
 Links will open in a new pop-up window. |
http://www.uaf.edu/water/faculty/nolan/pcms/index.html All questions regarding the content of this page shall be directed to Matt Nolan <fnman@uaf.edu>. |